

Umnat Seebuaphan/iStock via Getty Images

Thesis
iShares Biotechnology ETF (NASDAQ:IBB) is a fund created by BlackRock, Inc (BLK). The fund accounts for 214 holdings, and aims to mimic the performance of the NYSE Biotechnology Index.
During 2020 and 2021, biotechnology companies experienced what in my opinion was an overly optimistic bullish cycle, given that during that period small biotech companies which were (some still are) in early stages of development were exhibiting market caps in the mid-single digit billion range. An example of that could be Allogene Therapuetics (ALLO), which at peak had a market cap around $6.23 billion despite being in early stages of clinical trials. Another example could be Beam Therapeutics (BEAM) which reached $8.64 billion despite being still in early stages of clinical trials. The 2020-2021 boom caused the biotech index, and therefore IBB, to temporarily outperform the SP500 and the SP500 Pharma (SP500-352020). However, since 2022, when the FED started the interest rate increases, the majority of the biotechnology companies has been struggling to fund operations, which in turn has significantly affected the valuations of those companies in early stages of development. Thus, causing the performance decline of the Biotech index, to levels far below the SP500 and SP500 Pharma sector (see image below).
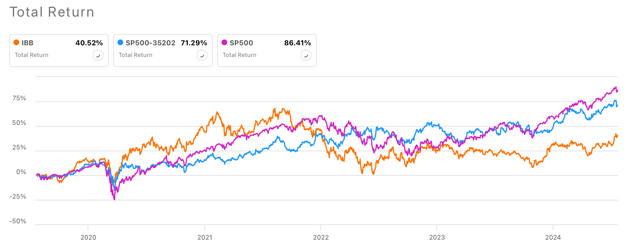
5-y Total Returns IBB vs SP500 Pharma vs SP500 (Seeking Alpha)
In addition to the interest rates, the uncertainties associated with the U.S. elections, and the impact of the Inflation Reduction Act on the cost of medicines, has been intensifying the pressures on biotech companies. Hence, leading them to optimise their pipelines, lay-off large portions of their workforce, and in certain cases declare bankruptcy, which in turn has caused volatility in the sector.
On the plus side, the most recent data on the consumer price index (CPI), showing inflation is trending down at a faster pace than expected, seems to support an interest rate cut in the second half of 2024.
Although the scarcity of funds is a big threat for most biotech companies, in particular those in early-stages of development, I believe that the operations optimization not only allowed those companies to survive with limited funds, but more importantly enabled them to thrive, accelerating the development of the most promising product candidates. In this sense, the FDA has granted regulatory approval to 22 new products in 2024 so far. Suggesting that 2024 full year approvals might be similar to the 55 new drugs that obtained regulatory approvals in 2023, and on track to outperform the 37 new approvals in 2022. Hence, biotech and pharmaceutical companies have been able to enhance their operations while fostering innovations that are likely to generate revenue and secure the growth of the sector.
On the other hand, the fast-paced advances in artificial intelligence (AI), generative AI, and machine learning are supporting a revolution in all business sectors. Biotech companies are not the exception, in my opinion, the use of those technologies is likely to significantly accelerate the drug discovery process, and therefore reduce the cost associated with it. Furthermore, as I commented in my previous analysis, AI-powered operations have the potential to optimise manufacturing processes, improve marketing strategies, streamline data analysis and clinical-trials, as well as optimise the filling of regulatory applications. Thus, I believe AI is likely to lead us into a new era in Biotech and Pharma.
Considering the role of AI, potential interest rate cuts, the increasing interest of big pharma on acquiring products in late stages of development (given their patent cliff and buying power), and more importantly the growing number of innovative advances that are leading to the release of novel drugs with high revenue potential. I think the biotech sector is showing strong signs of growth, which are likely to bring up the overall value of the Biotech Index, and therefore IBB. Indeed, a recent analysis, suggesting that the sector is currently undervalued, estimated that once IBB breaks out from the $140 resistance line, the current price is $148.26, the next barrier would be at $160.
Hence, in this article I will be providing information describing the most relevant features of IBB, revenue performance of the top commercial products, pipeline highlights related to the sector, growth potential and valuation based on IBB’s top 25 holdings, and risks. Thus, providing readers with an in-depth analysis of the sector, supporting my “buy” rating for long-term growth investors, and empowering investors to make informed decisions on whether they should consider investing in IBB.
iShares Biotechnology ETF Overview
This ETF was launched in February 2001, it currently accounts for 214 holdings with $7.931 billion in net assets, and 0.02% of average bid/ask spread during the last 30 days.
IBB aims to replicate the performance of the NYSE Biotechnology index. In this sense, hypothetical investments of $10,000 in IBB and the Biotech index from 2001, would be now $46,205.76 vs $49,993.20 respectively, assuming dividend reinvestment and after deducting management fees (see image below). Thus, so far exhibiting a similar performance than the index.
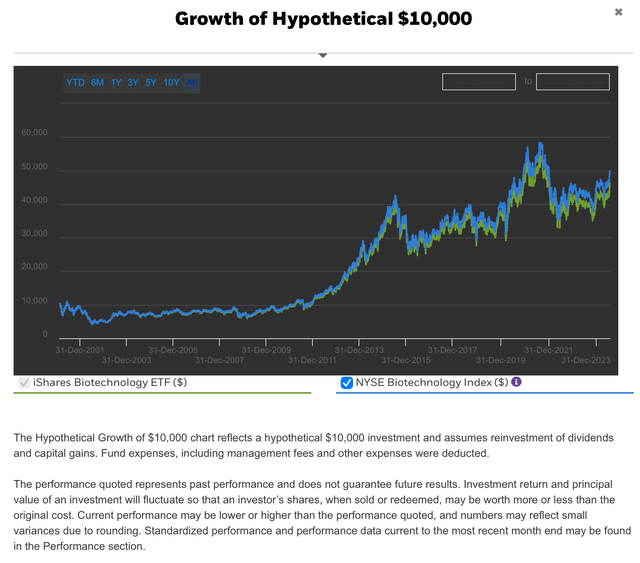
Hypothetical $10,000 investment in IBB vs NYSE Biotechnology Index (IShares Biotechnology ETF website)
In terms of strategy, as described in its prospectus, the fund management uses the representative sampling strategy, which they define as it follows:
“Representative sampling” is an indexing strategy that involves investing in a representative sample of securities that collectively has an investment profile similar to that of an applicable underlying index. The securities selected are expected to have, in the aggregate, investment characteristics (based on factors such as market capitalization and industry weightings), fundamental characteristics (such as return variability and yield) and liquidity measures similar to those of an applicable underlying index. The Fund may or may not hold all of the securities in the Underlying Index
In this sense, IBB invests at least 80% of its funds in securities included in the Biotech Index, while the other 20% may be invested in options & swap contracts, cash & equivalents, etc. Although the allocations may change overtime, at the time of writing the fund has 81.2% of its funds invested in securities from the Biotechnology sector, 15.73% in securities from the Life Sciences Tools & Services, 2.33% in pharmaceutical securities and the rest is invested in Healthcare securities and cash & equivalents.
IBB balances its allocation based on market cap, which means that companies with a large market cap account for a larger portion of the fund investment than those with a smaller market cap. In this sense, as per today, the top 25 IBB’s holdings account for 70.7% of the fund’s assets (see image below). Hence, unless otherwise noted, for the purpose of the ETF analysis, I will consider the top 25 stocks of the ETF as a representative sample of the overall ETF.
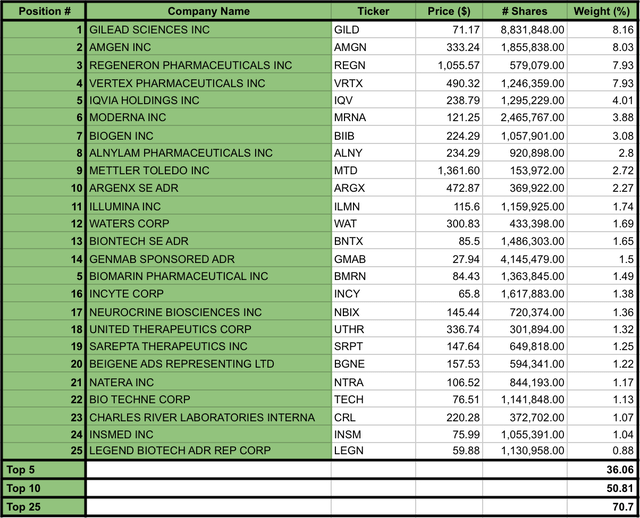
IBB’s Top 25 Holdings as per July 26, 2024 (Data compiled by the Author from iShares Biotechnology ETF website)
Commercial products performance based on IBB’s top 25 stocks
The performance of the commercially available products is one of the main growth drivers when assessing the current and near future performance of biotech companies. Thus, in the following table, I have listed the top sales revenue drivers for the top IBB’s 25 companies.
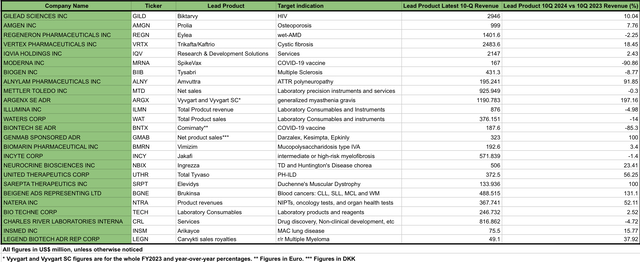
Top revenue product sales revenue performer for IBB’s top 25 holdings (Data compiled by the author from the latest 10-Q report of each company listed)
From the table presented above, 16 of the top products have reported a positive revenue growth, with nine of them showing growth of 20% or higher. On the other hand, there are nine products showing a decrease in sales revenue, from which only 2 of them (MRNA and BNTX COVID-vaccines) exhibited a decrease of 20% or higher. However, past performance does not guarantee future results.
In this sense, to have a better understanding of the potential future performance of those products, it is important to consider the longevity of the patents and the competition that those products might be facing.
Building on this, Regeneron has been forced to defend its Eylea (aflibercept) from biosimilar’s attacks. Although, so far the company has been successful at stopping the launch of biosimilars, given the recent expiry of Eylea’s U.S. market exclusivity, I would expect Eylea’s biosimilars to be commercially available in the near future. Moreover, wet age-related macular degeneration (wet-AMD) is a therapeutic area observing increasing interest from biotech companies. Indeed, in my recent analysis focused on Ocular Therapeutix (OCUL), I highlighted that they are developing a single injection treatment for wet-AMD that is currently being compared against Eylea in clinical trials. Additionally, RegenXBio (RGNX) in collaboration with AbbVie (ABBV) are developing ABBV-RGX-314 single injection gene-therapy for wet-AMD, and are expecting to file for regulatory approvals in late 2025 or early 2026 at the latest. Thus, Eylea’s sales-revenue potential is likely to continue its decreasing trend once more effective competitors and/or biosimilars gain a larger portion of the market share. Despite Eylea’s decline, the company recently got a label expansion in chronic obstructive pulmonary disease (COPD) for Dupixent in Europe and is awaiting the FDA decision in Q3. If approved in the U.S., Global Data has estimated Dupixent is likely to reach up to $21.4 billion in sales revenue by 2029.
Tysabri, which was developed by Biogen (BIIB) and Eisai Co., Ltd. (OTCPK:ESAIY) for the treatment of multiple sclerosis (MS), has also shown a negative trend. Indeed, Biogen has seen a revenue decrease of their whole multiple sclerosis franchise associated with the expiration of their patents, which is allowing the commercialisation of biosimilars. Despite the MS franchise decline, the company has been releasing positive news, including the approval of Leqembi in the U.S., Japan, China, South Korea. However, last Friday the European Medicines Agency recommended refusing the marketing authorisation for Leqembi in Europe based on the risk of developing amyloid-related imaging abnormalities (ARIA), in plain English, brain swelling/bleeding. At the time of FDA approval, Leqembi was the first FDA approved treatment against the progression of Alzheimer’s disease. However, Eli Lilly (LLY) has recently obtained FDA approval for Kisunla, which has the same indication as Leqembi. Biogen’s Q1 2024 10Q reported $184.6 million in revenue associated with Leqembi. BIIB has reported several challenges on the commercialisation of Leqembi, including the lack of patient/physician awareness, risk of ARIA, reimbursement hurdles, etc. But, in the recent Goldman Sachs 45th Annual Global Healthcare Conference, the management reported they are receiving an increasing number of order prescriptions from medical centres, as well as growing numbers of new prescribers.
In terms of competition, the World Health Organization (WHO) estimated that Alzheimer’s disease is responsible for approximately 60-70% of the 55 million people suffering with dementia worldwide. Thus, given the size of the Alzheimer’s global market, which has been estimated to be around $14 billion, I believe Biogen and Eli Lilly are likely to be able to secure large revenues from their drugs. Moreover, in my opinion, the Alzheimer’s market will be able to support the potential arrival of other treatments in early development, including Voyager Therapeutics (VYGR)’s VY-TAU01 and TAU silencing gene therapy.
The largest revenue losers were SpikeVax from Moderna (MRNA) and Comirnaty from BioNTech (BNTX) in collaboration with Pfizer (PFE). Given that COVID-19 is no longer a high risk condition for most people, partially as a consequence of the global vaccination efforts, the demand for COVID-19 vaccines has fallen sharply in 2024. In this sense, MRNA’s and BNTX’s total revenues have suffered a big hit this year. On the plus side, based on their last quarterly report, MRNA holds $8.5 billion in cash and cash equivalents, while BNTX holds $16.9 billion. Both companies are leveraging their strong cash positions to fund operations and foster very interesting pipeline developments, which I will be explaining in the following section.
Ingrezza, commercialised by Neurocrine (NBIX) for the treatment of Tardive Dyskinesia (TD) and Huntington’s Disease chorea, has been observing a steady revenue increase since its first approval. Indeed, in my recent analysis of NBIX, I mentioned that the recent approval of a new formulation of Ingrezza supports Neurocrine’s guidance for the franchise to reach sales revenues up to $2.1-2.2 billion in 2024. Additionally, the company is expecting the FDA decision associated with Crinecerfont’s NDA by late December 2024. Based on Crinecerfont’s strong positive results in patients suffering with congenital adrenal hyperplasia (CAH), I would expect the FDA to grant regulatory approval. Moreover, Neurocrine holds a very promising mature pipeline portfolio, which I will be summarising in the next section.
Elevidys, developed by Sarepta (SRPT), a gene-therapy for the treatment of Duchenne’s muscular dystrophy (DMD), was recently granted with a broad label expansion and traditional approval. In my previous analysis on Sarepta and Catalent, I described Elevidys revenue potential as well as its competitive landscape. In summary, I believe Elevidys’ DMD gene-therapy monopoly is safe from competitors for at least 2-3 years. Moreover, the label expansion is likely to have a very positive impact on Elevidys-driven sales revenue.
Natera (NTRA), a company focused on the development and commercialisation of non-invasive prenatal testing (NIPT), cancer and organ health tests. As I described in my analysis of the company, Natera is poised with growth given the rise of personalised medicine, particularly in the field of personalised cancer treatments.
Similarly, Vertex Pharmaceuticals (VRTX) has continued to observe sales-driven growth from their cystic fibrosis (CF) franchise. However, as I explained in my analysis, the company is expected to boost its product revenue when it starts realising the sales of Casgevy, their gene-therapy for the treatment of Sickle Cell Disease and Beta Thalassemia. While its mature and diverse pipeline, more on this in the next section, is likely to provide further growth opportunities.
Overall, I believe IBB’s top 25 companies are exhibiting a strong performance in terms of product sales and sustainability that is likely to ensure revenue growth and shareholder returns.
Pipeline Highlights based on IBB’s top 25 stocks
The pipeline of a biotech company is a key factor for estimating its potential future growth. However, it is also important to take into account that funding the development of product candidates is expensive. Thus, in my opinion, there is a fine balance between the number of product candidates in the active pipeline and the company’s cash flows. In this sense, given the restricted access to cash in the last 2 years, many biotech companies have been pushed to optimise their operations, prioritise the development of certain products in the pipeline and find partnerships that enable them to reach into the pocket of companies with larger budgets. As a result, I believe the biotech companies have been able to accelerate the development of the most promising product candidates.
Amgen (AMGN) and Gilead (GILD) not only are showing positive trends in terms of product sales, but also have been delivering positive news associated with their GLP-1 product candidates Mari-Tide and GS-4571, respectively. Given the success observed by Novo Nordisk (NVO) and LLY with their GLP-1 weight loss drugs, the market is very optimistic about the revenue potential of AMGN and GILD if/when their GLP-1 drugs obtain regulatory approval. Indeed, analysts are expecting AMGN to outperform the SP500 in 2024.
On the other hand, Vertex has numerous products in their pipeline with the potential to become blockbuster drugs. For instance, The FDA is expected to have a decision on Vanza trio’s NDA by January 2025. If approved, Vanza trio will be the next generation of Trikafta/Kaftrio for cystic fibrosis. In addition, the company has reported positive results associated with a non-opioid aimed for the treatment of moderate to severe acute pain, called Suzetrigine. Those results supported the NDA filing for Suzetrigine in acute pain, while clinical trials evaluating its efficacy on diabetic neuropathic pain, chronic pain, are undergoing. In this sense, the non-opioids chronic pain market has been estimated, by Future Market Insights, to be around $78 billion in 2024, and it is expected to double in the next 10 years. If approved, pain treatment could be Vertex’s next blockbuster franchise. Thus, boosting the company’s growth.
Moderna’s pipeline includes a mRNA-based treatment for cystic fibrosis, which has been developed in collaboration with Vertex, which is in Phase 1 clinical trials. However, in my opinion the most promising product candidate in MRNA’s pipeline is mRNA-4157, co-developed with Merck (MRK), which has recently started Phase 3 clinical trials. This product candidate has been tested as a co-adjuvant of Keytruda for the treatment of patients with resected high risk melanoma, and non-small cell lung cancer.
Similarly, BioNTech has been deploying its resources on the development of mRNA-based treatments against various types of cancer, such as r/r melanoma and non-small cell lung cancer. BioNTech’s cancer treatment candidates are currently undergoing assessment in Phase 2 clinical trials.
Taking in consideration the strong financial position of MRNA and BNTX, and the cancer vaccine market size, which was estimated to be approximately $10.21 billion in 2023 with a projected CAGR of 11.44% between 2024-2033. I believe BioNTech and Moderna cancer vaccines are likely to become their next blockbuster products once they obtain regulatory approvals.
Another company with a large and promising list of product candidates is Neurocrine. Among NBIX’s pipeline portfolio, there are numerous Muscarinic drugs in Phase II clinical trials for the treatment of central nervous system disorders, such as Schizophrenia. In this sense, NBI-‘568, will be reporting top line results in Q3 2024. Additionally, they released positive phase 2 clinical trial results for NBI-‘845 on the treatment of major depression disorder (MDD) and are expected to have a meeting with the FDA in order to decide the next steps. The Schizophrenia market size, in the seven major markets, was estimated to be approximately $9.480 billion in 2023, and it is expected to reach up to $15 billion by 2034. Likewise, the MDD market size is estimated to be approximately $23.56 billion by 2029. Hence, highlighting the revenue potential of NBIX product candidates.
The list of interesting pipeline product candidates with large revenue potential is long, IBB holdings, generally speaking, have been demonstrating their capacity to foster innovation despite the cash flow hurdles. Given the pipeline advances, several biotech companies are presenting really attractive valuations, exhibiting a high risk/high reward profile that may be suitable for investors with a risk tolerant portfolio.
Valuation
IBB is currently trading at $148.26, with 53.5 billion outstanding shares and net assets amounting to $7.931 billion. According to the iShares Biotechnology ETF’s website, the P/E ratio is 24.43, while the P/B ratio is 4.26.
In terms of technical analysis, the share price chart shows the appearance of a bullish trend that has been taking place since mid-April. Furthermore, the exponential moving average (EMA) and the moving average convergence/divergence (MACD) are signalling for a “strong buy” rating, supporting the multiple (see image below). On the other hand, the relative strength index is currently at 68.8%, suggesting the stock has not reached its peak yet. Indeed, the premium/discount to net asset value ratio is currently 0.8%, which suggests the ETF stock is still trading at a discount even after soaring 18.95% since mid-April.
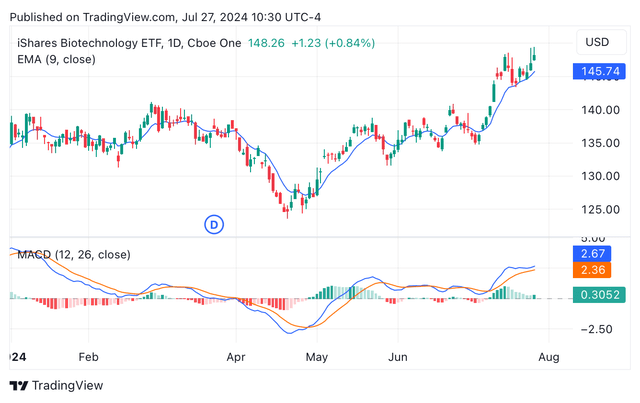
IBB year-to-date candle chart depicting EMA and MACD (Seeking Alpha/TradingView)
In terms of liquidity, IBB’s assets under management (AUM) is $7.93 billion, which is significantly higher than the median ETF AUM, which stands at $249.32 million.
Building on the analysis of the top 25 holdings, in the following table you will be able to appreciate a collection of ratings from Seeking Alpha’s Quant, Seeking Alpha’s Analysts, and Wall Street’s Analysts, as well as my blended rating which assigned scores to each of the other ratings and translated it into an overall blended rating for each of the top 25 holdings (see image below).
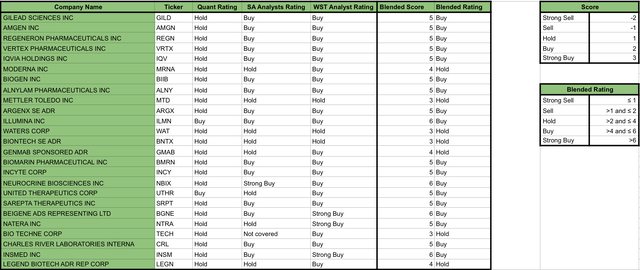
Valuation ratings of IBB’s Top 25 holdings (Data collected by the Author from Seeking Alpha)
Based on the ratings provided above, I would like to highlight that none of the ratings recommend “Sell” any of the top 25 stocks. While in terms of overall scores, the Quant rating seems to be the most cautious, rating the majority of the stocks as a “Hold”, while Wall Street Analysts seems to be the most optimistic, recommending “Buy” or “Strong Buy” for 88% of the stocks. Finally, my blended rating assigned “Buy” rates to 72% of the stocks and “Hold” to the other 28% (see image below).
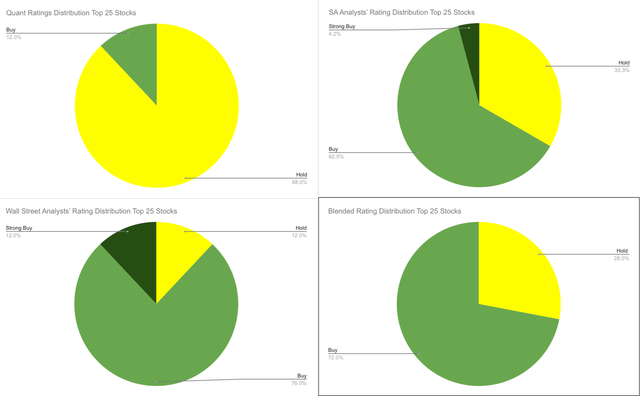
IBB’s Top 25 holdings rating distributions (Author’s own work)
Although I would recommend investors to do their own research, in my opinion the “Buy” rating for 72% of the stocks accounting for 70% of IBB’s assets is a good sign, in terms of providing an overall guidance about the value and growth potential of the fund. Generally speaking, when analysing the performance of biotech companies, analysts would provide their recommendations based on macroeconomic trends affecting the sector, sales-performance of the commercially available products, pipeline potential, and overall financial performance of the companies. Thus, taking in consideration the innovation power of Biotech companies that I highlighted in the previous sections, together with an overall optimistic macroeconomic environment, I believe the Biotech sector is fueled with growth opportunities.
Hence, I rate IBB’s shares as a “Buy”, based on the ETF technical valuation, the “Buy” rating on 72% of IBB’s top 25 holdings, their good commercial performance and promising pipeline developments, as well as the potential interest rate cuts in 2024 that will alleviate the cash flow hurdles. Nonetheless, investors should be aware of a series of risks associated with a potential investment in iShares Biotechnology ETF.
Risk
Despite the numerous positive signs supporting a bullish thesis on IBB, investors should take in consideration that this ETF by definition is highly exposed to one sector (biotech).
Although the biotech sector has been able to temporarily outperform the SP500 in the past, companies in this sector are often under a highly competitive and fast-paced environment. The development of novel therapies is usually a costly and timely-intensive process. In this sense, biotech companies with no commercial products are likely to be largely affected by cash flow restrictions such as high interest rates, as reported in the Beyond Borders 2024 report issued by EY. Currently, the market is reacting under the speculation of interest rate cuts, however there is still a possibility for the FED to delay the interest rate cuts until 2025.
On the other hand, the valuation of biotech companies is frequently affected by their capacity to develop efficient treatments as well as their sales performance. For instance, BIIB’s shares have fallen 7% yesterday after Leqembi’s regulatory setback was announced by the EMA. Nonetheless, it is also important to remark that the ETF holds positions on 214 assets, which reduces the impact of individual assets on the overall performance of the ETF. Thus, despite BIIB’s 7% decline, IBB shares rose by 0.84%.
Furthermore, the Inflation Reduction Act is aimed to regulate the cost of certain medicines. This may negatively affect profit margins and revenue potential of several commercial treatments as well as the pipeline product candidates. However, in my opinion this risk should be mitigated at least partially if biotech companies optimise their operations, reducing their operating expenses and increasing sales by leveraging the power of AI-based tools.
Additionally, investors are encouraged to revise potential taxes disadvantages that may apply to them when trading ETF shares and/or tax disadvantages related with receiving ETF’s distributions.
Conclusion
In summary, I consider that iShares Biotechnology ETF is poised for growth. The biotech sector has been going through a couple of years of restructuring and pipeline prioritisation lead by the poor cash flows. However, as explained through this article, generally speaking the sector has been able to maintain high levels of success on their innovations, receiving a larger number of FDA approvals in 2023 than previous years and with 2024 set for at least matching 2023 figures.
In terms of revenue potential, the majority of IBB’s top 25 holdings are showing strong signs of growth, with strong mature pipelines and good sales performance of their commercial products.
As commented in the risk section, the biotech sector is often volatile. News associated with drug approvals/rejections, clinical trial outcomes, patent cliffs, rising number of competitors, etc. may largely affect the valuations of the companies. However, the diversification within the sector should reduce the effect of individual stocks movements on the ETF valuation.
Building on this, I believe the extraordinary advances in AI, generative AI, and machine learning will have a large impact on the biotech’s performance as they will be able to optimise their overall operations and increase profit margins. Leading then to a new era in the pharma and biotech sectors.
On the other hand, a delay on the interest rate cuts may cause a pessimist market environment that is likely to negatively impact the valuation of companies in the biotech sector. However, the large advances on innovative products and product candidates from biotech companies is likely to facilitate partnerships and M&A transactions between large pharmaceutical companies and biotech companies.
Hence, the overall positive developments in the sector, together with a potential macroeconomic environment favouring the growth of the Biotech sector support my “buy” rating for IBB. Nonetheless, investors are encouraged to analyse the information provided in here and elsewhere and decide if an investment on IBB suits their portfolio.
Editor’s Note: This article was submitted as part of Seeking Alpha’s Best Growth Idea investment competition, which runs through August 9. With cash prizes, this competition — open to all analysts — is one you don’t want to miss. If you are interested in becoming an analyst and taking part in the competition, click here to find out more and submit your article today!”


GIPHY App Key not set. Please check settings