Sunday Runday

(Image credit: Android Central)
In this weekly column, Android Central Wearables Editor Michael Hicks talks about the world of wearables, apps, and fitness tech related to running and health, in his quest to get faster and more fit.
The Polar Vantage M3 is the brand’s first affordable AMOLED watch, after the $599 Vantage V3 and $749 Grit X2 Pro first shed off the old MIP standard. The $399 M3 shares their 4th-gen Elixir OHR and dual-band GPS, meaning it should offer reliable accuracy on par with Polar’s flagships.
I decided to put this to the test! Despite the rainy weather and coming down with a cold, I took the Polar Vantage M3 on several runs, long walks, and a track run over the past couple of weeks, comparing the results against the Garmin Fenix 8’s dual-band GPS, the COROS HRM armband, and the Polar H10 chest strap.
When I pitted the Vantage V3 against flagship Garmin and COROS watches, it fell a bit short for GPS accuracy (while still doing better than a GPS-only watch) and was fairly accurate for HR data compared to a chest strap. So I was curious to see how the mid-range Vantage M3 would do with similar hardware.
Turns out the Polar Vantage M3 is quite reliable for GPS, but a little less reliable for heart rate accuracy in some cases. Still, the mid-range M3 is already making the flagship V3 look a little overpriced by offering the same experience for less.
Polar Vantage M3 GPS accuracy
(Image credit: Michael Hicks / Android Central)
I used the Fenix 8 as a location accuracy control group because Garmin’s dual-band GPS tends to lead the industry for dependable results in my tests. The mid-range COROS PACE Pro did surprisingly well against it in my accuracy test earlier this month, so I had high hopes that the Vantage M3 could do equally well.
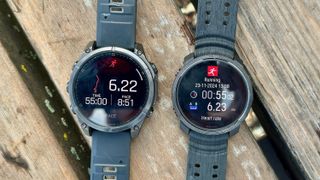
Swipe to scroll horizontallyActivityPolar Vantage M3Garmin Fenix 811/13 (Run)4.04 miles; 324W; 58 TL; 164 spm4.01 miles; 351W; 76 TL; 162 spm11/17 (Run)2.00 miles; 312W; 30 TL; 164 spm2.02 miles; 338W; 43 TL; 162 spm11/17 (Track run)4,020m; 477W; 50 TL; 182 spm4,010m; 503W; 260 TL; 180 spm11/17 (Walk)6.31 miles; 83 TL; 124 spm6.33 miles; 31 TL; 116 spm11/21 (Run)3.03 miles; 322W; 44 TL; 164 spm3.01 miles; 351W; 61 TL; 163 spm11/21 (Walk)3.27 miles; 29 TL; 126 spm3.27 miles; 15 TL; 123 spm11/23 (Run)6.23 miles; 350W; 142 TL; 168 spm6.22 miles; 381W; 166 TL; 164 spm
I’m sorry that so many of my tests were short jogs — which tend to be too short to reveal discrepancies — or long walks that are usually too slow-paced to challenge the antenna’s full abilities. I didn’t get to go on a hike for proper elevation testing or accuracy on a tree-obscured route, either.
From what I was able to test, however, the Vantage M3 did respectably well, always falling closely within the same margins as the Garmin watch for a long run.
Image 1 of 7


If you look more closely at the GPS map between the Vantage M3 (orange line) and Fenix 8 (blue) for my most recent 10K run above, there are a few instances where the Vantage M3 drifts slightly into the street or buildings, with the same unprompted zig-zagging and hard angles as the dual-frequency Suunto Race, as well as some issues with underpasses that the Fenix 8 didn’t encounter.
Thankfully, the Vantage M3 has fewer gaffes than Suunto and does perfectly well in normal conditions, sticking to the correct side of my local trail. And for my track run below, it didn’t stick perfectly to the first lane, but that’s something every watch I’ve tested struggles with; Polar’s result is actually among the best I’ve seen among dual-band watches.

(Image credit: Android Central)
While I couldn’t do a proper hike, my walk along another nearby trail was illuminating. In the screenshots below, you’ll see how the Vantage M3 (now the blue line) does perfectly well on the unimpeded stretches, but under tree cover, you’ll see a lot more wavering in short stretches where I was walking straight ahead (and Garmin’s orange line is usually more consistent). My total distance was only two-hundredths apart, though, so most people won’t mind.
Image 1 of 4


Overall, I think people will be happy with the Vantage M3’s location accuracy, especially for its price. What’s perhaps more interesting is how Garmin and Polar consistently track running power, training load, and steps per minute differently.
I’m inclined to trust Garmin over Polar for steps; Garmin has won several step-counting accuracy tests, and Garmin, Apple, COROS, and Fitbit all closely matched on total steps and cadence across a 20-mile, four-watch test.
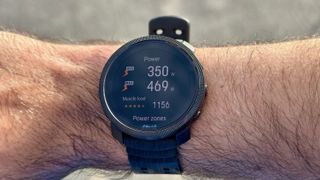
But I’ve noticed in the past how Garmin training load seems to underestimate walks and overestimate track workouts, while Polar separates cardio and muscle load in a way that feels more sophisticated and accurate to my effort level — aside from the grossly-underestimated track load. And running power has always felt like an arbitrary metric that varies by brand, so I don’t put much stock in it.
Polar Vantage M3 HR accuracy
(Image credit: Michael Hicks / Android Central)
My Polar Vantage M3 heart rate results gave me whiplash. For most normal runs, it delivered consistent HR averages, if all slightly below my external HRMs. But my track run results were disappointing and my walk data showed the correct averages but was bizarrely wild on the graphs.
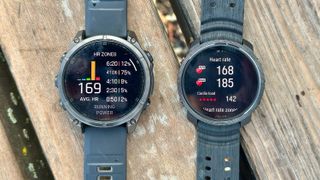
Swipe to scroll horizontallyActivityPolar Vantage M3COROS HRM or Polar H1011/13 (Run; COROS)146 bpm / 155 max; 546kcal147 bpm / 155 max; 536kcal11/17 (Run; COROS)146 bpm / 157 max; 279kcal146 bpm / 157 max; 274kcal11/17 (Track run; COROS)175 bpm / 193 max; 285kcal179 bpm / 190 max; 285kcal11/17 (Walk; COROS)122 bpm / 146 max; 1,119kcal123 bpm / 146 max; 773kcal11/21 (Run; COROS)146 bpm / 157 max; 418kcal147 bpm / 157 max ; 409kcal11/21 (Walk; COROS)111 bpm / 120 max; 463kcal111 bpm / 120 max; 372kcal11/23 (Run; Polar H10)168 bpm / 185 max; 954kcal169 bpm / 186 max; 859kcal
For every run except one two-mile jog, the Polar Vantage M3 was 1 bpm short of my optical arm band or my Polar ECG. In the two HR graphs below (hit the magnification button), you can see how the purple Garmin graph sits slightly above the pinker Polar one at most points, aside from when my effort dips and Polar is slower to drop.
Image 1 of 2


There’s normally a delay between wrist- and arm-based optical monitors or chest straps, but a solid fitness watch should still average out to the same result in the end. I’d like to see Polar figure out its algorithm to close the small gap, but 1 bpm isn’t a major issue and it’s still in the right ballpark.
What’s slightly weirder is looking at my two walking activity charts. Polar really struggled to stay close to my fluctuating heart rate for both activities, with a 5–10 bpm gap above or below my actual HR for sustained stretches.
Image 1 of 2


They ended up averaging out to identical or close bpm averages for 6- and 4-mile walks; so again, perhaps you won’t care about the difference. But that may have been luck more than everything else; I noticed this 5Krunner HR accuracy test did fine for most runs but had bizarrely inflated HR totals for a calm walk. So I’m hoping this is an area where the Polar algorithm can improve with time.
(Image credit: Android Central)
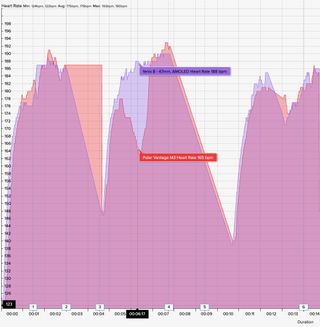
As for my track workout, I can only show a portion of the graph because it somehow got fully misaligned in-between lap pauses about halfway through, so the results were needlessly confusing. This portion gives you a glimpse of what to expect, though: a few beats short at most points, dipping as low as 20 bpm under at one point, and overestimating my max by a few beats. Basically, it’s all over the place.
I’m going to do an unpaused track run for my full Vantage M3 review, to avoid any weird issues with flat, skewed results. But even with this incomplete test, I feel like the Vantage M3 could have done much better in that initial snapshot. If I were a serious athlete trying to track anaerobic effort, I’d probably buy an external monitor to pair with my Vantage M3.
The Polar Vantage M3 holds its own
(Image credit: Michael Hicks / Android Central)
There’s a new category of AMOLED running watches that cost about the same as an Apple Watch or Pixel Watch but offer a serious leg up for training metrics, battery life, and accuracy.
If I had to choose between the COROS PACE Pro ($349), Suunto Race S ($349), Polar Vantage M3 ($399), and Garmin Forerunner 265 ($449), I’d have a seriously tough decision on my hands — but I’d also feel like I couldn’t go wrong with any one choice.
With the Vantage M3 in particular, I appreciate its lightweight and thin design, Strava route and Komoot directions integration, full suite of sensors like ECG and skin temp, and default topo maps.
Its 7-day battery life is on the short side for a running watch, and I’m not the biggest fan of Polar Flow as a companion app, but it doesn’t feel like a major downgrade from the pricier Vantage V3, with similar perks like its useful VO2 Max and orthostatic tests and comparable accuracy. While I’ve yet to review it fully, the Vantage M3 looks more compelling than the V3 for sheer value.
I just wish it was a little more accurate for anaerobic runs or low-effort aerobic.
Mid-range running excellence
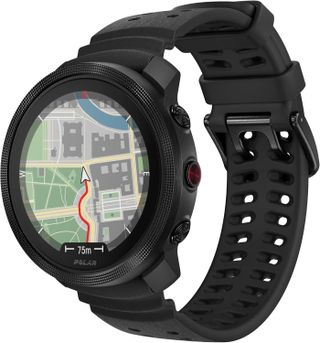
While the Polar Vantage M3 is cheaper than the Vantage V3, it has the same water resistance, health sensors, multi-band GPS, training and recovery software, fitness tests, topographical maps, and limited smart tools for $200 less. It has a shorter battery life, a smaller display, and cheaper materials, but it’s otherwise a more compelling option for most runners.


GIPHY App Key not set. Please check settings