

by BLACK ENTERPRISE Editors

November 3, 2025
Thus, SmartAsset used the latest edition of this IRS data to determine which states have adopted Bitcoin and other cryptocurrencies at the highest rates, enabling insights for economic, technological, and even political preferences in some areas.
Over 2.78 million Americans reported actively participating in cryptocurrencies according to the latest IRS data, with estimates suggesting Bitcoin prevalence for roughly 75% of all users. The rise in Bitcoin’s value over the years — along with other currencies — has undoubtedly made many investors’ fortunes. But the IRS did not start tracking general cryptocurrency involvement in earnest until 2020, when it began asking tax-filers about their participation, regardless of a taxable sale.
Thus, SmartAsset used the latest edition of this IRS data to determine which states have adopted Bitcoin and other cryptocurrencies at the highest rates, enabling insights for economic, technological, and even political preferences in some areas.
Key Findings
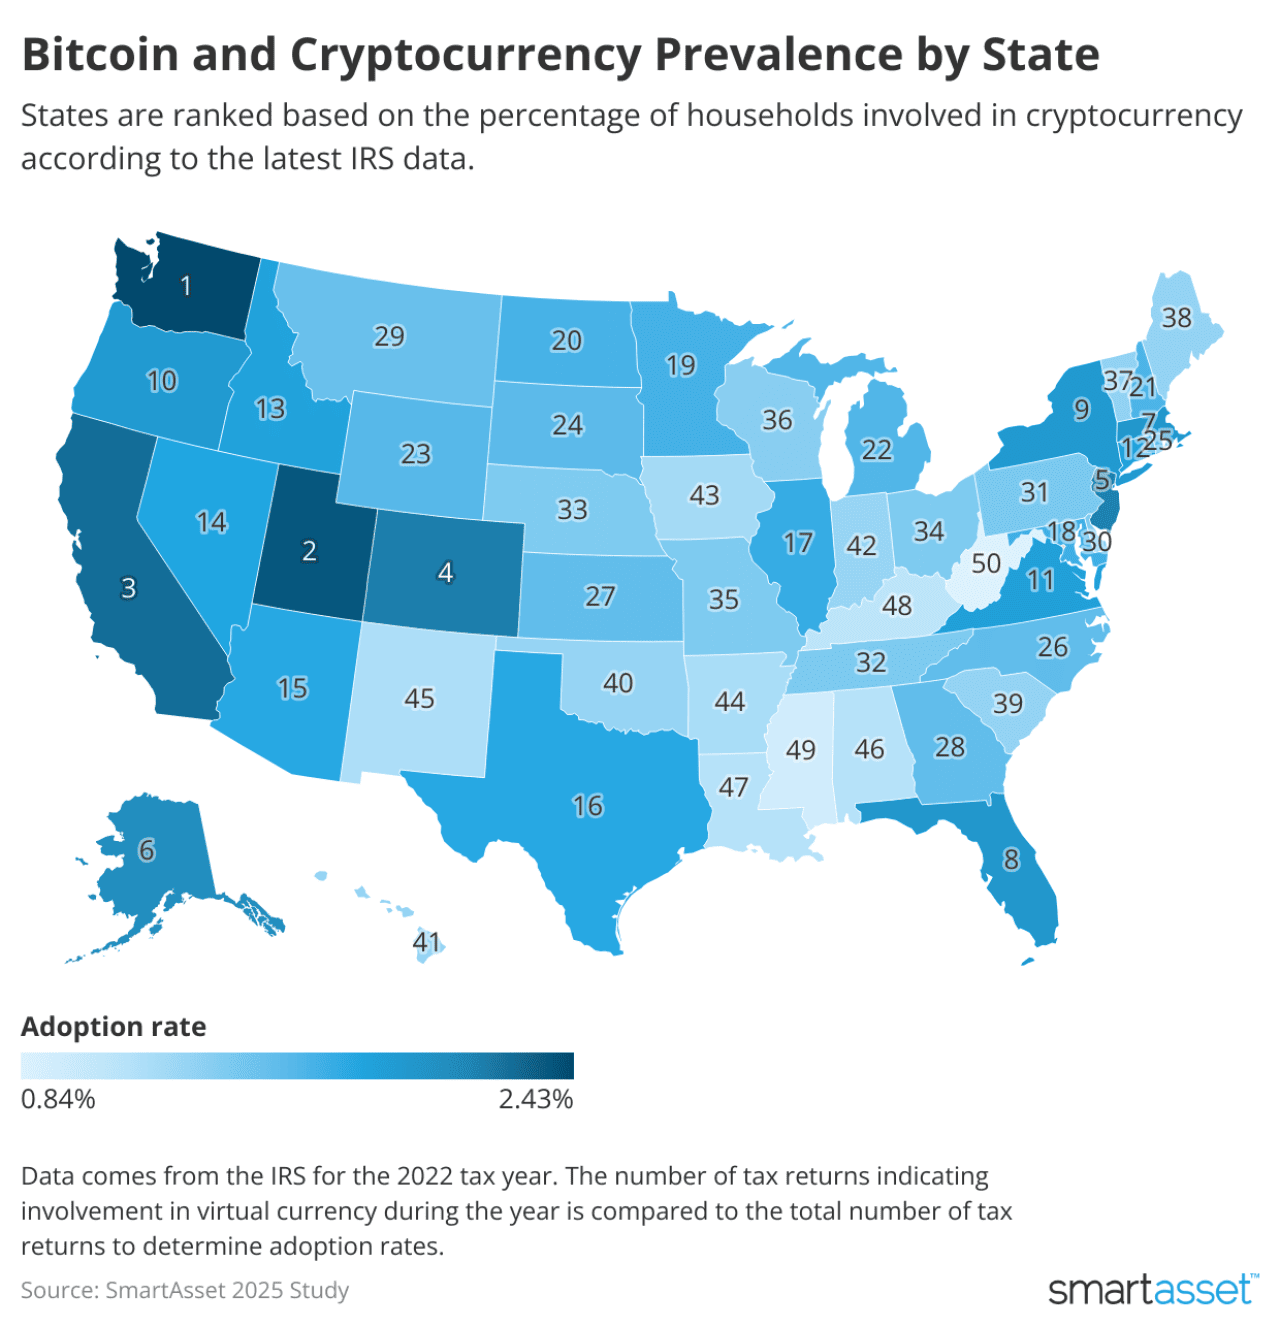
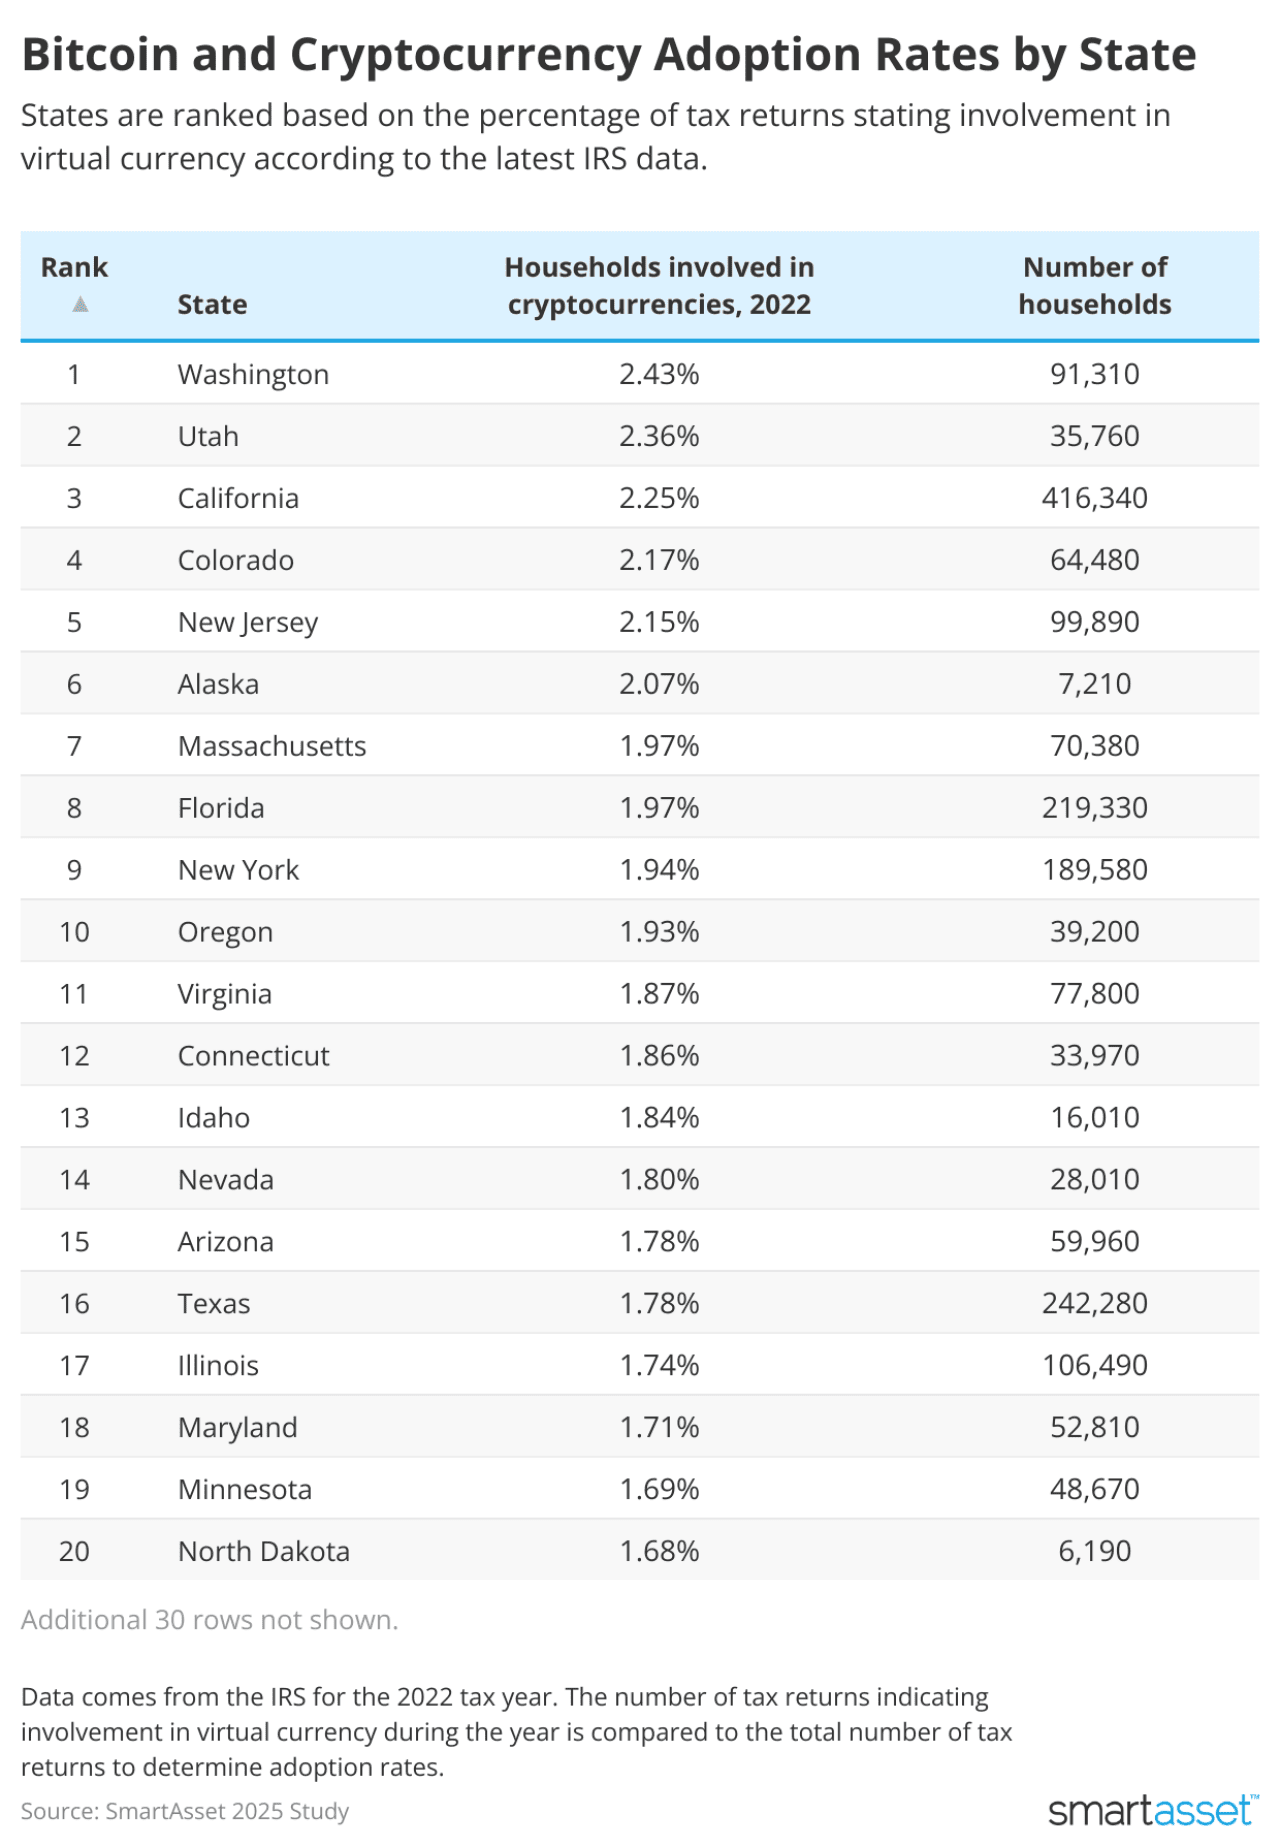
Washington has the highest rate of cryptocurrency use. As of 2022, 2.43% of tax returns filed in Washington were involved with cryptocurrency during the year. Washington has led in this metric for three straight years. Overall, crypto adoption trends are strongest in western states, with Utah (2.36%), California (2.25%), Colorado (2.17%), and Oregon (1.93%) all earning spots among the top 10.
About three times as many people participated in crypto in 2021 as in other years. Crypto adoption topped 5% in a handful of states in 2021, a year in which Bitcoin’s price doubled from roughly $32,000 to $64,000, reaching highs not to be seen again until 2024. Adoption topped out at 6.22% in Washington that year. Across all states, the average adoption rate was 1.26% in 2020, 3.8% in 2021, and 1.6% in 2022.
Cryptocurrency adoption has been the least popular in the South. Less than 1% of households are involved in cryptocurrencies in West Virginia (0.84%) and Mississippi (0.95%), with Kentucky (1.1%), Louisiana (1.15%), and Alabama (1.16%) rounding out the rest of the lowest-participant states.
High earners are two to five times more likely to participate in cryptocurrency. For households earning $500,000 or more annually, the crypto adoption rate stands at 5.55%, reaching 5.64% for those earning $1 million or more per year. Meanwhile, the adoption rate for households earning between $1 and $75,000 per year averages around 1.27%. This jumps up to 1.95% for households earning $75,000 to $100,000. For those earning between $100,000 and $200,000 annually, the adoption rate is 2.62%, reaching 4.28% for those earning between $200,000 and $500,000.
 SmartAsset
 SmartAsset
Where Bitcoin and Cryptocurrency Are Most Prevalent
States are ranked by the percentage of tax returns indicating involvement with virtual currency and bitcoin during the 2022 tax year.
Washington
2022: 2.43% (91,310 households)
2021: 6.22% (233,980 households)
2020: 2.1% (80,680 households)
Utah
2022: 2.36% (35,760 households)
2021: 5.69% (84,570 households)
2020: 1.89% (28,230 households)
California
2022: 2.25% (416,340 households)
2021: 5.19% (977,200 households)
2020: 1.78% (347,170 households)
Colorado
2022: 2.17% (64,480 households)
2021: 5.29% (156,080 households)
2020: 1.83% (53,580 households)
New Jersey
2022: 2.15% (99,890 households)
2021: 4.48% (205,020 households)
2020: 1.47% (69,280 households)
Alaska
2022: 2.07% (7,210 households)
2021: 5.58% (19,530 households)
2020: 1.82% (6,550 households)
Massachusetts
2022: 1.97% (70,380 households)
2021: 4.58% (162,530 households)
2020: 1.58% (57,700 households)
Florida
2022: 1.97% (219,330 households)
2021: 4.31% (467,200 households)
2020: 1.43% (161,170 households)
New York
2022: 1.94% (189,580 households)
2021: 4.2% (411,730 households)
2020: 1.44% (146,730 households)
Oregon
2022: 1.93% (39,200 households)
2021: 4.93% (100,940 households)
2020: 1.65% (34,450 households)
Virginia
2022: 1.87% (77,800 households)
2021: 4.65% (191,500 households)
2020: 1.58% (67,040 households)
Connecticut
2022: 1.86% (33,970 households)
2021: 4.21% (76,730 households)
2020: 1.39% (25,900 households)
Idaho
2022: 1.84% (16,010 households)
2021: 4.31% (37,350 households)
2020: 1.37% (11,930 households)
Nevada
2022: 1.8% (28,010 households)
2021: 3.92% (61,240 households)
2020: 1.33% (21,330 households)
Arizona
2022: 1.78% (59,960 households)
2021: 4.38% (147,680 households)
2020: 1.45% (49,960 households)
Texas
2022: 1.78% (242,280 households)
2021: 4.38% (590,820 households)
2020: 1.46% (200,670 households)
Illinois
2022: 1.74% (106,490 households)
2021: 3.96% (243,070 households)
2020: 1.34% (84,540 households)
Maryland
2022: 1.71% (52,810 households)
2021: 4.18% (127,570 households)
2020: 1.45% (45,320 households)
Minnesota
2022: 1.69% (48,670 households)
2021: 3.99% (113,720 households)
2020: 1.28% (36,880 households)
North Dakota
2022: 1.68% (6,190 households)
2021: 4.23% (15,570 households)
2020: 1.33% (4,980 households)
New Hampshire
2022: 1.66% (12,180 households)
2021: 3.53% (25,730 households)
2020: 1.08% (8,070 households)
Michigan
2022: 1.64% (79,930 households)
2021: 3.7% (180,400 households)
2020: 1.26% (63,350 households)
Wyoming
2022: 1.62% (4,560 households)
2021: 3.79% (10,700 households)
2020: 1.17% (3,350 households)
South Dakota
2022: 1.6% (7,080 households)
2021: 3.5% (15,480 households)
2020: 1.13% (4,990 households)
Rhode Island
2022: 1.59% (9,030 households)
2021: 3.8% (21,340 households)
2020: 1.24% (7,150 households)
North Carolina
2022: 1.58% (77,880 households)
2021: 3.75% (183,630 households)
2020: 1.26% (64,220 households)
Kansas
2022: 1.57% (21,370 households)
2021: 3.64% (49,790 households)
2020: 1.16% (16,340 households)
Georgia
2022: 1.57% (77,340 households)
2021: 3.79% (186,800 households)
2020: 1.34% (68,010 households)
Montana
2022: 1.54% (8,470 households)
2021: 3.7% (20,230 households)
2020: 1.24% (6,820 households)
Delaware
2022: 1.45% (7,310 households)
2021: 3.45% (17,180 households)
2020: 1.16% (5,910 households)
Pennsylvania
2022: 1.45% (91,670 households)
2021: 3.34% (214,460 households)
2020: 1.14% (74,630 households)
Tennessee
2022: 1.44% (46,820 households)
2021: 3.56% (115,680 households)
2020: 1.16% (38,950 households)
Nebraska
2022: 1.43% (13,460 households)
2021: 3.38% (31,680 households)
2020: 1.06% (10,010 households)
Ohio
2022: 1.43% (81,420 households)
2021: 3.43% (197,860 households)
2020: 1.11% (65,330 households)
Missouri
2022: 1.43% (41,120 households)
2021: 3.39% (97,840 households)
2020: 1.13% (33,910 households)
Wisconsin
2022: 1.39% (40,840 households)
2021: 3.36% (98,660 households)
2020: 1.08% (32,450 households)
Vermont
2022: 1.34% (4,510 households)
2021: 3.19% (10,740 households)
2020: 1.12% (3,870 households)
Maine
2022: 1.33% (9,480 households)
2021: 3.21% (22,990 households)
2020: 1.03% (7,390 households)
South Carolina
2022: 1.33% (32,880 households)
2021: 3.24% (79,360 households)
2020: 1.11% (27,980 households)
Oklahoma
2022: 1.32% (22,590 households)
2021: 3.25% (55,990 households)
2020: 1.04% (18,480 households)
Hawai’i
2022: 1.32% (9,090 households)
2021: 3.03% (20,990 households)
2020: 1% (7,060 households)
Indiana
2022: 1.31% (42,620 households)
2021: 3.22% (104,910 households)
2020: 1.03% (34,510 households)
Iowa
2022: 1.25% (18,620 households)
2021: 2.87% (42,790 households)
2020: 0.95% (14,710 households)
Arkansas
2022: 1.22% (15,800 households)
2021: 2.87% (37,570 households)
2020: 1.02% (13,850 households)
New Mexico
2022: 1.2% (11,890 households)
2021: 3.04% (29,840 households)
2020: 1.05% (10,430 households)
Alabama
2022: 1.16% (25,010 households)
2021: 2.74% (59,360 households)
2020: 0.94% (21,060 households)
Louisiana
2022: 1.15% (22,600 households)
2021: 2.73% (55,020 households)
2020: 0.96% (20,070 households)
Kentucky
2022: 1.1% (21,760 households)
2021: 2.74% (54,740 households)
2020: 0.91% (18,800 households)
Mississippi
2022: 0.95% (11,790 households)
2021: 2.08% (26,380 households)
2020: 0.76% (10,040 households)
West Virginia
2022: 0.84% (6,530 households)
2021: 1.79% (14,120 households)
2020: 0.57% (4,670 households)
Data and Methodology
Data comes from the U.S. Internal Revenue Service (IRS) SOI Tax States – Historic Table 2: Individual Income and Tax Data for tax year 2022, the latest year available. Data for 2020 and 2021 were also considered. States were ranked based on the percentage of tax returns filed that indicated involvement in virtual currencies throughout the tax year. A taxable sale of cryptocurrency and bitcoin was not necessary for a positive response.
This story was produced by SmartAsset and reviewed and distributed by Stacker.
RELATED CONTENT: Kevin Durant’s Bitcoin Skyrockets Despite Being Locked Out Of Account



GIPHY App Key not set. Please check settings