
Wirestock

My Stance On Recent Analyses and My Thesis
I have read various Ferrari N.V. (NYSE:RACE) analyses and concluded that many of them praise the brand’s undeniably positive qualities, including the company’s strategy and its approach to exclusivity and scarcity. For example, Porsche produces in a year as many cars as Ferrari has in its entire history, or Ferrari’s annual output is equivalent to just ten hours of production at Toyota. This artificial limitation of supply results in a 24-month waiting list, in line with the founder’s principle that Ferrari would always deliver one car fewer than the market demanded. This, however, comes with the crucial limitation that Ferrari’s growth must be constrained in a way that excessive growth could harm its exclusivity. Brand development in China follows this exact approach, where slow, controlled growth is considered necessary to maintain the scarcity that is so vital to Ferrari’s identity. What gives the company the perspective to continue this growth with consistent high profitability for years to come is that, unlike mass-market discretionary goods, I do not consider production cost pressure to be a significant concern – it should easily be passed on to the affluent customer base. Additionally, the total addressable market of high net worth individuals shows no signs of high Ferrari penetration yet. Lastly, there might be positive halo effects with Lewis Hamilton as the new Ferrari racing driver, but I wouldn’t overestimate this impact, given that the relevant segment is relatively small compared to the entire company.
While most analysts point out the high valuation of the company, I felt that this crucial point was often underemphasized, relying solely on Multiple discussions. As a result, I decided to conduct a fundamental discounted cash flow valuation of Ferrari, including integrated planning calculations, even though many bullish analysts might argue that this approach isn’t useful for this company that can control its own figures by consciously leaving demand potential untapped.
Here’s what my thesis will cover as I describe my assumptions for Ferrari in my DCF analysis:
Defining and analyzing Ferrari’s value drivers, including questioning whether traditional price elasticities are entirely void, as the conventional wisdom regarding luxury goods like Ferrari suggests. Analyzing historical top-line growth alongside peer performance, management guidance, and analysts’ forecasts to derive well-informed projections. Highlighting CAPEX planning, often neglected as a factor that impacts free cash flow when discussing future growth opportunities. While describing various other assumptions for the integrated financial model for Ferrari, I will not fall short of emphasizing its phenomenal performance, brand, and quality as a company. However, I do not see this justifying ANY valuation at any given time after the stock has surged 27% just this year, or more than doubled since its 2022 lows, with a current P/E ratio of 55.
Ferrari and the (non-existent?) Snob-Effect
Admittedly, this headline is provocative. While common discretionary goods, affordable to lower-income individuals, follow the mechanics of a downward-sloping demand curve – meaning demand decreases as prices increase – Ferrari might be a prime example of the so-called Snob Effect, where this “law” does not apply. Essentially, this effect, driven by perceived or deliberately created scarcity and exclusivity, can increase demand despite – or perhaps because of – increased pricing, making the product affordable only to high-income or high-net-worth individuals. Let’s examine to what extent this applies to Ferrari by analyzing its top-line value drivers.
With 86% of the company’s revenues, the “Cars and Spare Parts” segment is the primary driver, followed by “Sponsorships, Commercial & Brand” with a 10% share of revenue. The first segment is non-financially driven by the number of cars sold. By dividing the segment’s revenue by the number of cars sold, I calculate an average sale price per car, allowing me to analyze the pricing component separately from the quantity. From 2016 to 2023, an 8% annual increase in shipments, along with a 5% annual increase in pricing, contributed to a 13% annual growth rate in this most important segment. Other segments offset this growth, resulting in an overall 10% annual top-line growth for the company.
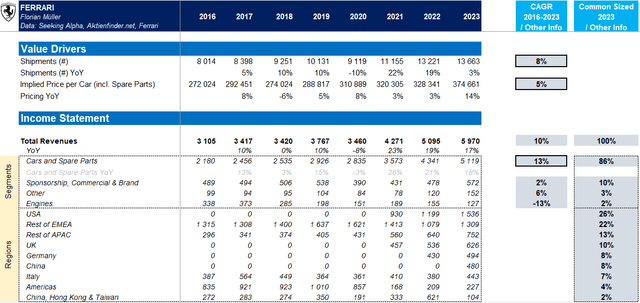
Author | Data: Seeking Alpha, Aktienfinder.net, Ferrari
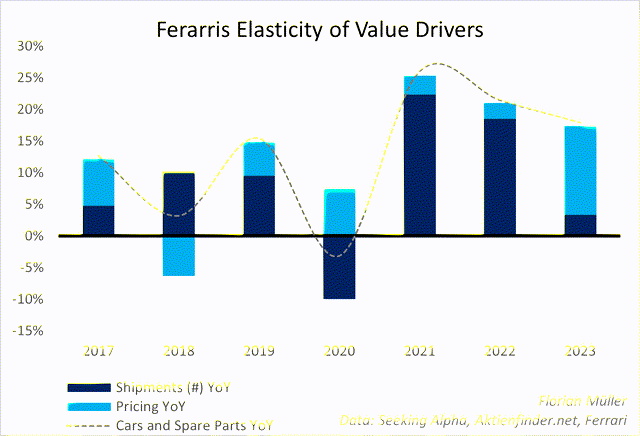
And yes, this leads to conclude that in most years Ferrari could increase prices alongside increasing shipments, but it can’t do so indefinitely. This means that despite significant pricing power, there is a limit to how much it can be pushed. In fact, Year-over-Year (YoY) pricing changes are slightly negatively correlated to YoY changes in shipments. This dynamic played out in the most recent year, where a 14% increase in pricing (up from 3% the year before) led to a slower 3% increase in quantity (down from 19% the year before). Despite this, the segment still achieved an impressive 18% revenue growth (and 17% for the company). However, this dynamic suggests that Ferrari is to at least some extent subject to the same economic mechanics as other microeconomic markets.
One possible flaw in this analysis is that these figures could be influenced by Ferrari’s strategy of limiting higher-priced cars, rather than being a true reflection of market demand, as often argued.
Author | Data: Seeking Alpha, Aktienfinder.net, Ferrari
Admittedly, Impressive Financial Performance
Moving on to forecasting Ferrari’s top-line, I first checked how reliable Ferrari’s own management guidance has been in the past. Excluding the turbulent COVID-19 year of 2020, Ferrari generally exceeded its own initial top-line guidance, leading to upward revisions throughout the years. Therefore, it’s not surprising that analysts’ consensus estimates for 2024 revenue, at 6.5 billion EUR (Aktienfinder.net based on FactSet, cross-verified with Seeking Alpha), are slightly higher than Ferrari’s own guidance of 6.4 billion EUR for FY 2024. Enough estimates are available through FY 2026 with projected growth rates slowing from 10% (CAGR 2016-2023) to 9% in 2024, and down to 7% by 2026. Thereafter, I have interpolated slowing growth towards the perpetual growth rate. For comparison, I included Porsche as a peer, which historically and in projections has significantly weaker growth but instead already today has much higher revenues. This highlights the advantage of Ferrari’s more exclusive, scarcity-driven business model, which allows Ferrari to manage its growth rate over time. Furthermore, Porsche’s margins, with 29% gross profit and 17% EBIT, are notably lower than Ferrari’s incredible 50% gross profit and 27% EBIT. In the forecast period, I kept these margins at their currently high level (margin-freeze). At the end of the article, I will include a sensitivity analysis to assess the impact of higher and lower future margins on the company’s valuation.
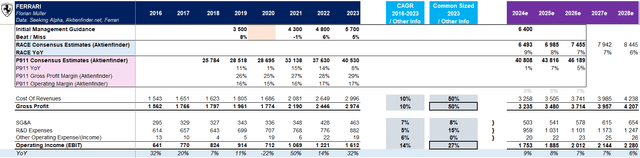
Author | Data: Seeking Alpha, Aktienfinder.net, Ferrari
Moving on to Ferrari’s non-operating section, not much is changing significantly with respect to interest expenses and other items, but an Italian corporate tax rate of 24% hast to be deducted in calculating net income. The historical average effective tax rate from 2016 to 2023 was around 22%. Thanks to increased efficiency over the years, Ferrari’s net income increased by 18% annually, compared to revenue growth of 10% over the same period.
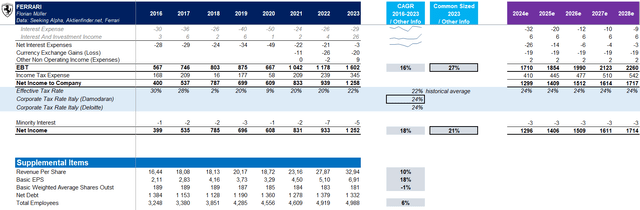
Author | Data: Seeking Alpha, Aktienfinder.net, Ferrari
Number Crunching, You Might Want To Skip
For the sake of brevity, I’ll spare you the detailed description of my complete balance sheet planning for Ferrari and instead summarize the key model assumptions below:
Cash balance as a result of the total cash flow planning. Planning inventory, accounts receivable, and accounts payable based on historical turnover rates. PP&E based on the upcoming CAPEX plans, less the historically implied depreciation rates or useful lives. Planning for interest-bearing debt based on known repayment dates for outstanding debt instruments or loans. Planning for equity by adding net income and subtracting historical payout rates for dividends and stock buybacks. Total Cash Flow calculated and planned indirectly by adjusting for or adding (non)-cash effects from balance sheet deltas (Operating part), subtracting CAPEX necessary for growth (Investing part), and accounting for expected debt repayments as well as shareholder returns (Financing part).
Ferrari
The Growth – Reinvestment – Free Cash Flow – Challenge
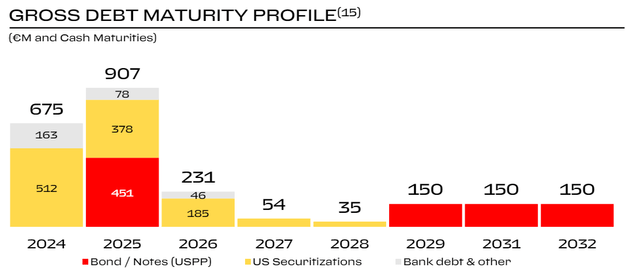
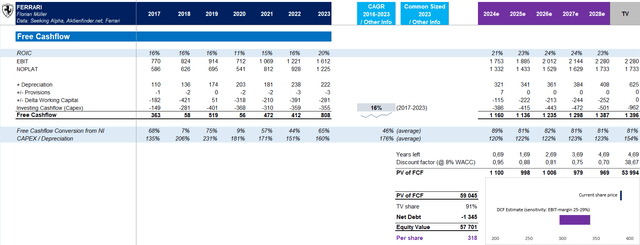
Growth does not come out of nowhere. High growth usually requires significant reinvestment, which puts pressure on Free Cash Flow, which, on the other hand, grows faster due to overall business growth – an interdependent circle. Ferrari is no exception to this, which is why CAPEX over the past eight years has increased by 16% annually alongside earnings growth. The company’s growth behavior is also evident in its CAPEX to depreciation ratio, ranging well above 100%, sometimes even around 200%. When aiming to assume high terminal value growth-which most analysts do for Ferrari due to their reasoning of untapped demand and slowly managed growth through exclusivity – one must consider high perpetual CAPEX.
As for Ferrari, I am definitely ready to support a high perpetual growth rate of 6%, aligning with the bullish analysts’ views. Given Ferrari’s above average rentability in the range of 15-20% (NOPLAT to Invested Capital), which significantly exceeds my calculated WACC of 8%, achieving a perpetual growth rate of 6% would require a consistent reinvestment rate of about 50-60% of operating after-tax income (i.e., NOPLAT). This is calculated as follows: an 11% return on newly invested capital (based on the historical ROIC approaching WACC) multiplied by a 55% retention rate results in a 6% perpetual growth rate. This retention rate is realistic for Ferrari without requiring a reduction in shareholder returns, given that its debt obligations are expected to become negligibly low during the forecast period. So, high growth? Yes, but at the cost of free cashflow due to the reinvestments needed.
Luxury Valuation for Luxury Fundamentals
That being said, let’s see how all of these aspects play out when we do the math. Please note that my Excel model is based on the assumptions and simplified calculation logic explained in this article, allowing for an integrated financial planning approach. As a result, some numbers or structures-especially in the cash flow statement-might differ from the official financial statements.
There’s nothing particularly noteworthy about Ferrari’s discount rate. I calculated it to be 8% based on the absence of significant country risks, given that the majority of its revenue comes from mature Western countries, but also not low enough to justify below-average risk with beta factors around 1. In my view, a market-standard discount rate of 8% for Ferrari’s planning in EUR is relatively undisputable. Likewise, I do not intend to question the perpetual growth rate (which I calculated at a relatively high 6% earlier) through a sensitivity analysis. I would neither want to become more nor less optimistic, especially since I support the bullish narrative at the operational level. As for the return on invested capital (ROIC), it remains above average during the planning period, whereas for the terminal value, I accounted for a convergence to the weighted average cost of capital (WACC), as described in the previous chapter.
Ultimately, I estimate Ferrari’s value per share at 318 EUR (around 340 USD), indicating an overvaluation of 20% or a valuation that’s approximately two years ahead of its fundamentals. Higher-than-expected EBIT margins (contrary to my planned margin freeze) are reflected in my sensitivity analysis, with a range of 25% to 29% margins. For example, with a 29% EBIT margin, I would estimate Ferrari’s value at 341 EUR per share – a margin increase that aligns more closely with current analyst estimates. Even with this higher margin, I would still consider Ferrari more than 10% overvalued. My first DCF estimate corresponds to a still-high P/E ratio of 46 – a level consistent with 5-year averages – whereas the current P/E is 55.
Author | Data: Seeking Alpha, Aktienfinder.net, Ferrari
RACE’ing Ahead Of Its Time
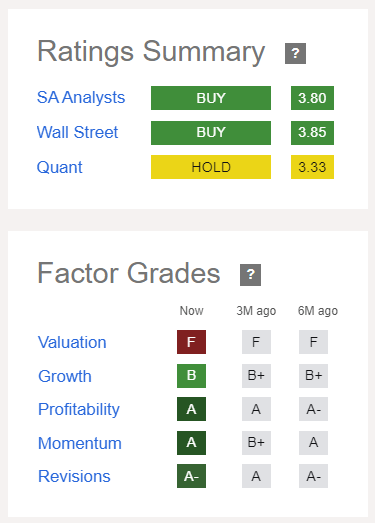
Given this perspective, the rather progressive DCF valuation, combined with the multiple comparisons, suggests that Ferrari stock is in the red RPM zone, which of course can still rev higher in terms of momentum. The Seeking Alpha factor grades, in my view, portray Ferrari perfectly: an outstanding company in all aspects, but currently valued quite expensively. Long-term investors may still achieve attractive returns based on today’s prices over many years, but in the short to medium term, Ferrari would not be a “buy” for me anymore, aligning me more with the Seeking Alpha Quant Rating than with typical analyst opinions.
Seeking Alpha


GIPHY App Key not set. Please check settings